
Who owns this dashboard?
I always try to send this newsletter on Tuesday.
This week, rural French internet had other ideas.
One sentence comes back in almost every analytics assessment I run:
"We don't really know who owns this."
- Sometimes it's the data
- Sometimes it's a dashboard
- Sometimes it's a metric
- Sometimes it's a business decision
- Sometimes it's an entire analytics product
And surprisingly, nobody finds this strange anymore.
Why ownership matters?
Before diving into analytics, let me share a small personal anecdote.
Near my home, there's a small path that around thirty people use every day.
Nobody maintains it.
The municipality believes it's the responsibility of the adjacent homeowners. The homeowners believe it belongs to the municipality.
Over time, weeds grow, litter accumulates, insects spread, and the path slowly deteriorates.
Everyone uses it. Nobody knows who owns it.
And that's exactly where the problems begin.
Why ownership disappears
Ownership rarely disappears in 1 day (Sometimes, it was never defined in the first place).
It slowly fades as teams grow.
- New analysts join
- Business domains evolve
- People change roles
- Projects become products
Eventually, everyone assumes someone else is responsible.
What you'll start seeing
When ownership is unclear:
- no one feels responsible for quality
- metrics evolve without governance
- dashboards multiply
- nobody knows who can approve a change
- incidents take longer to resolve
- adoption slowly declines
- confidence in analytics decreases.
The organization doesn't become slower because people are less capable.
It becomes slower because every important decision needs to rediscover its owner.
The ownership iceberg
When people talk about ownership, they usually think about data ownership.
In reality, analytics requires ownership at multiple levels.
- Business problem
- Metric
- Data
- Semantic layer
- Dashboard
- Decision
- Adoption
- Retirement
Each of these questions deserves an explicit owner.
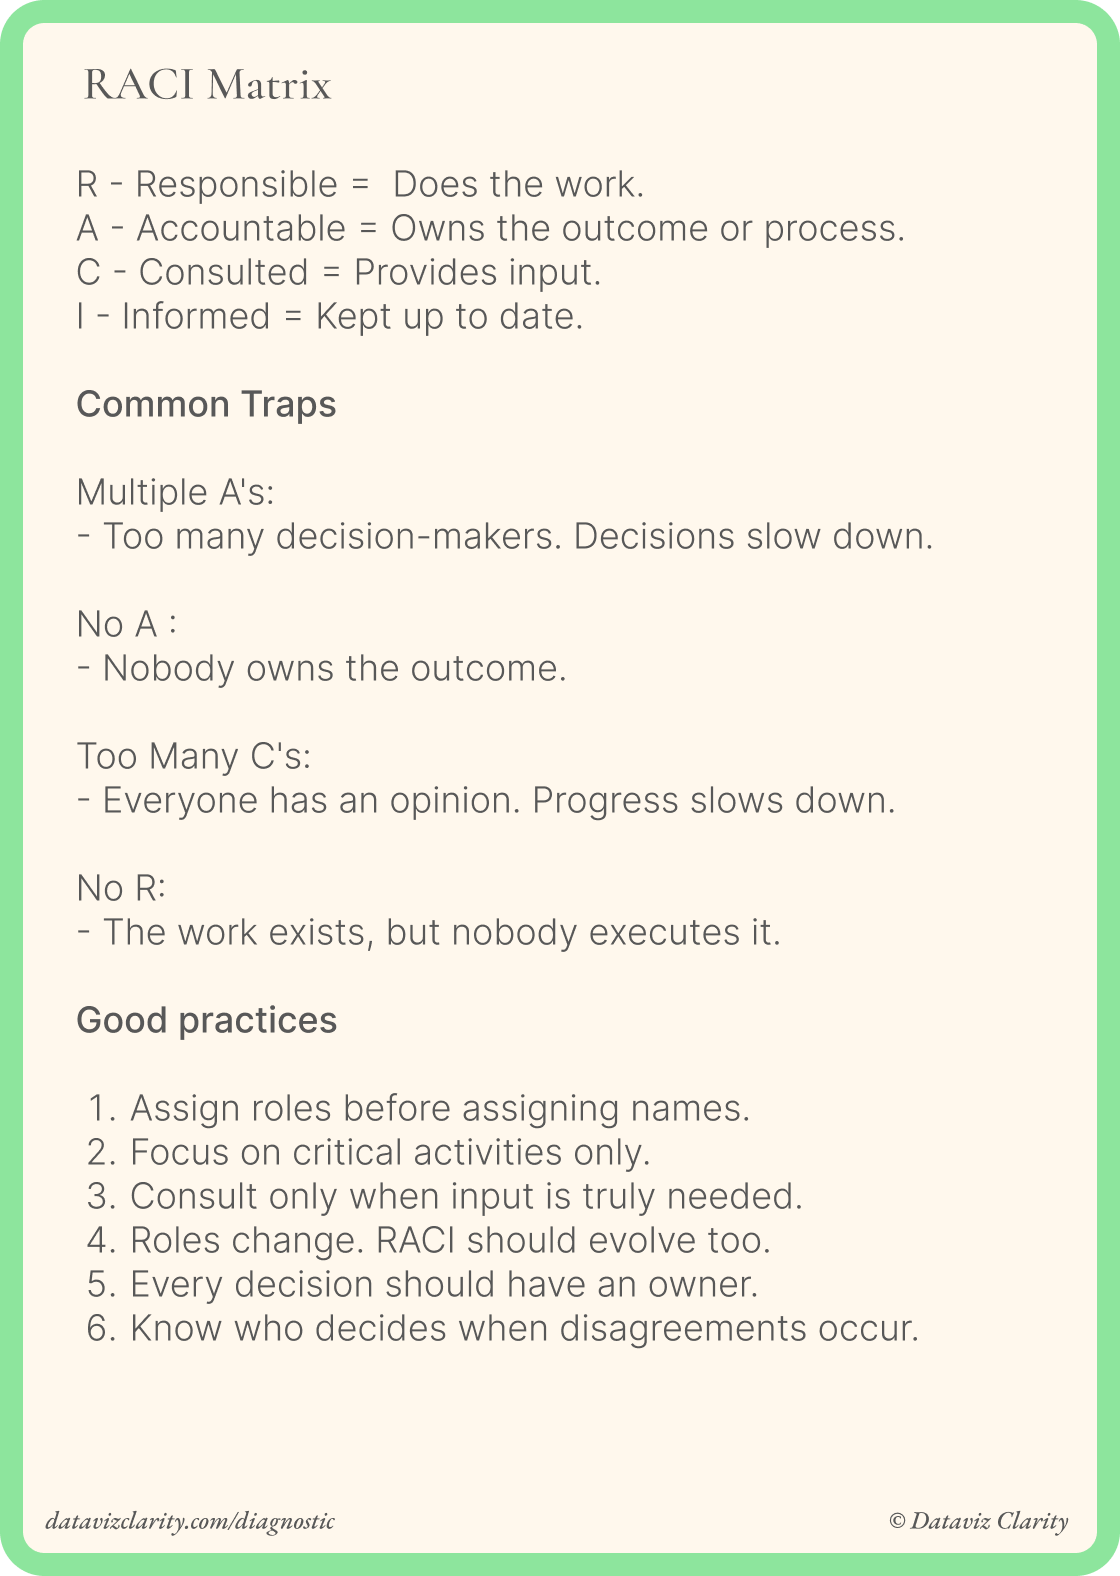
The Analytics RACI card.
Not to add more governance, but to make ownership visible.
Today's card is a Template card.
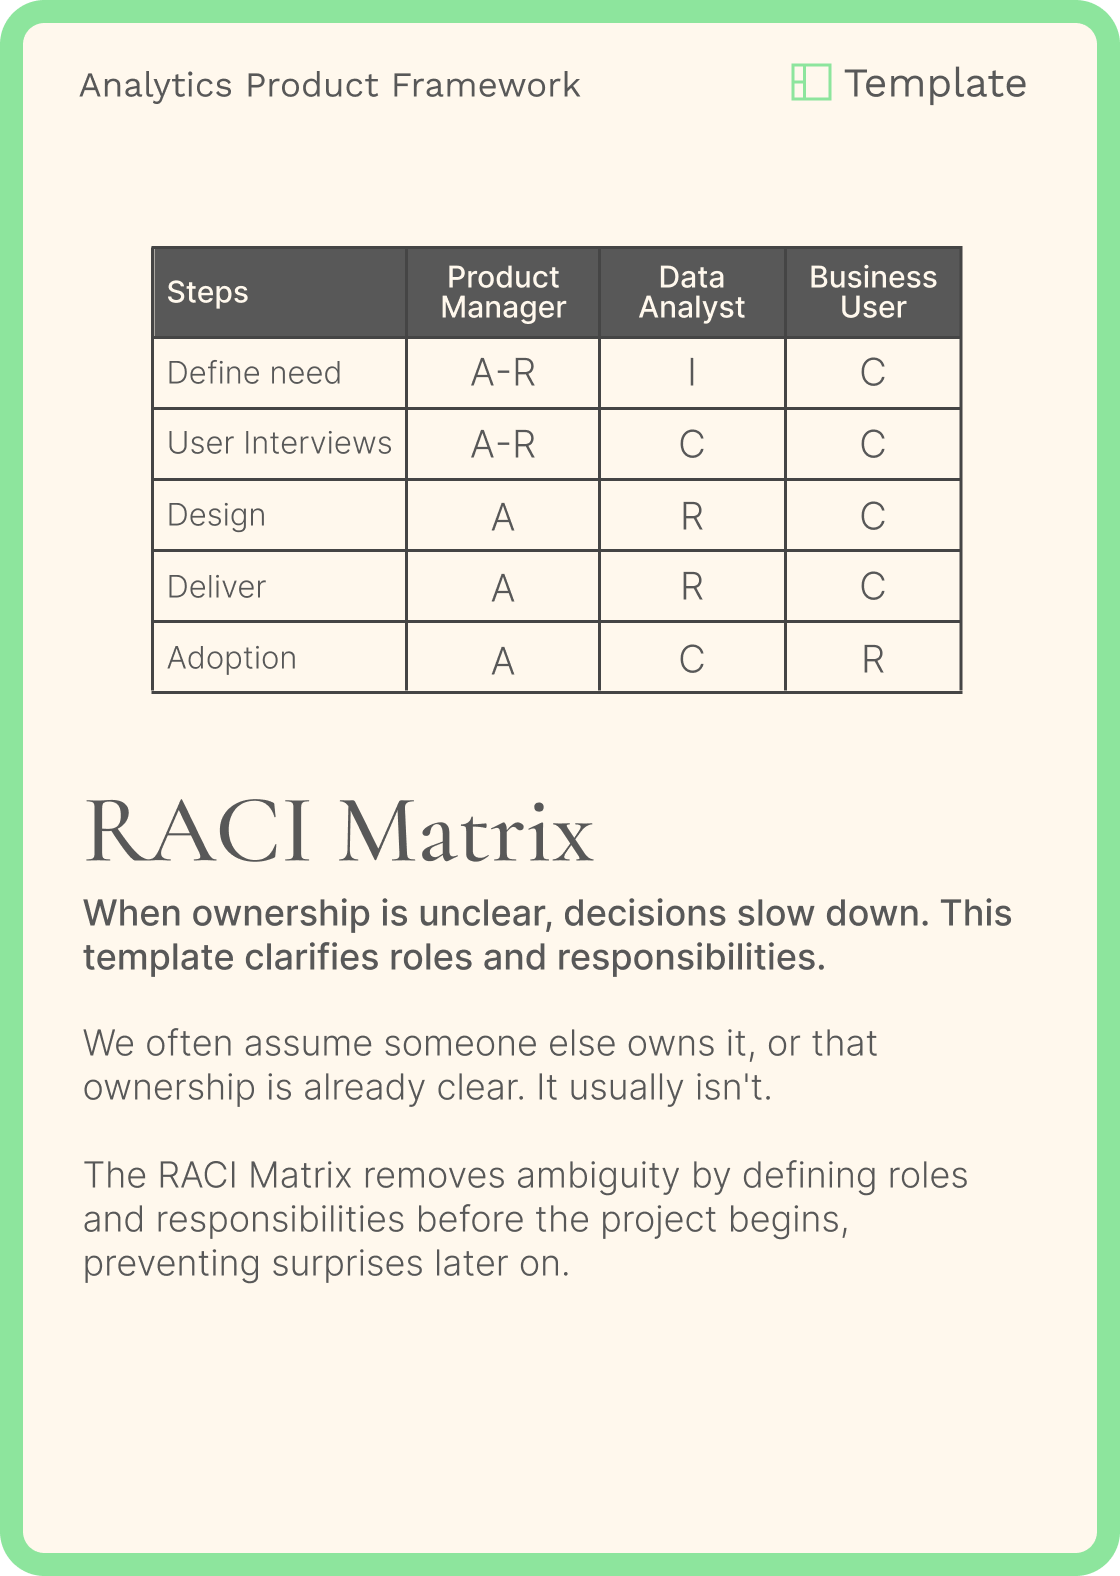
Because once ownership is explicit, decisions become faster, responsibilities clearer, and collaboration much easier.
Have a great week everyone!
Aurélien
Whenever you're ready, there are four ways I can help you and your team:
- Analytics Product Office: Give your team a dedicated Analytics Design Office: one ticket board, one place to ask questions, fast expert responses directly from me. Get support on user interviews, workshop facilitation, product thinking, methodology, communication, and analytics product practices whenever you need it.
- Analytics Diagnostic: Identify your team's biggest analytics challenges through interactive workshops.
- E-Learning: Learn Design Driven Dataviz: Master the fundamental design principles behind clear, intuitive, and impactful dashboards that people actually use.
- Youtube channel: Short videos about data strategy, analytics and data

Responses