
The Analytics Solution Tree + Launch soon
After months of work, the first deck is (almost) ready!
Wednesday at 9 AM Paris time, the deck will be available exclusively to people on the waiting list.
What's included?
- 34 cards in high-resolution PNG format to include in your presentations, highlight common traps, and show how to avoid them.
- A Miro board to diagnose your current process, prepare your projects with stakeholders and educate yourself and your team on Analytics Design best practices.
The Miro board will help you diagnose your current process, design a better one, and avoid common traps when working with stakeholders and end-users.
No launch discount. No special promotion (sorry)
The price will be 56$ / 49€.
I believe in the value of this methodology and in creating an actionable digital product that you can use throughout your Analytics projects.
If you need more hands-on support, my Analytics Design Process Workshop will also be available on the launch page.
Make sure you're on the waiting list to receive your access link tomorrow at 9 AM!
Card of the week: Analytics Solution Tree
One of the last cards I developed for tomorrow's launch is the Analytics Solution Tree.
Its purpose is simple: help Data Analysts, BI Developers, and Analytics Product Managers choose the most appropriate solution for a business need.
We tend to default to dashboards, even when a simpler solution could solve the problem.
But dashboards take time to design, develop, and maintain. They consume resources, create unnecessary complexity, and often overlap with existing products.
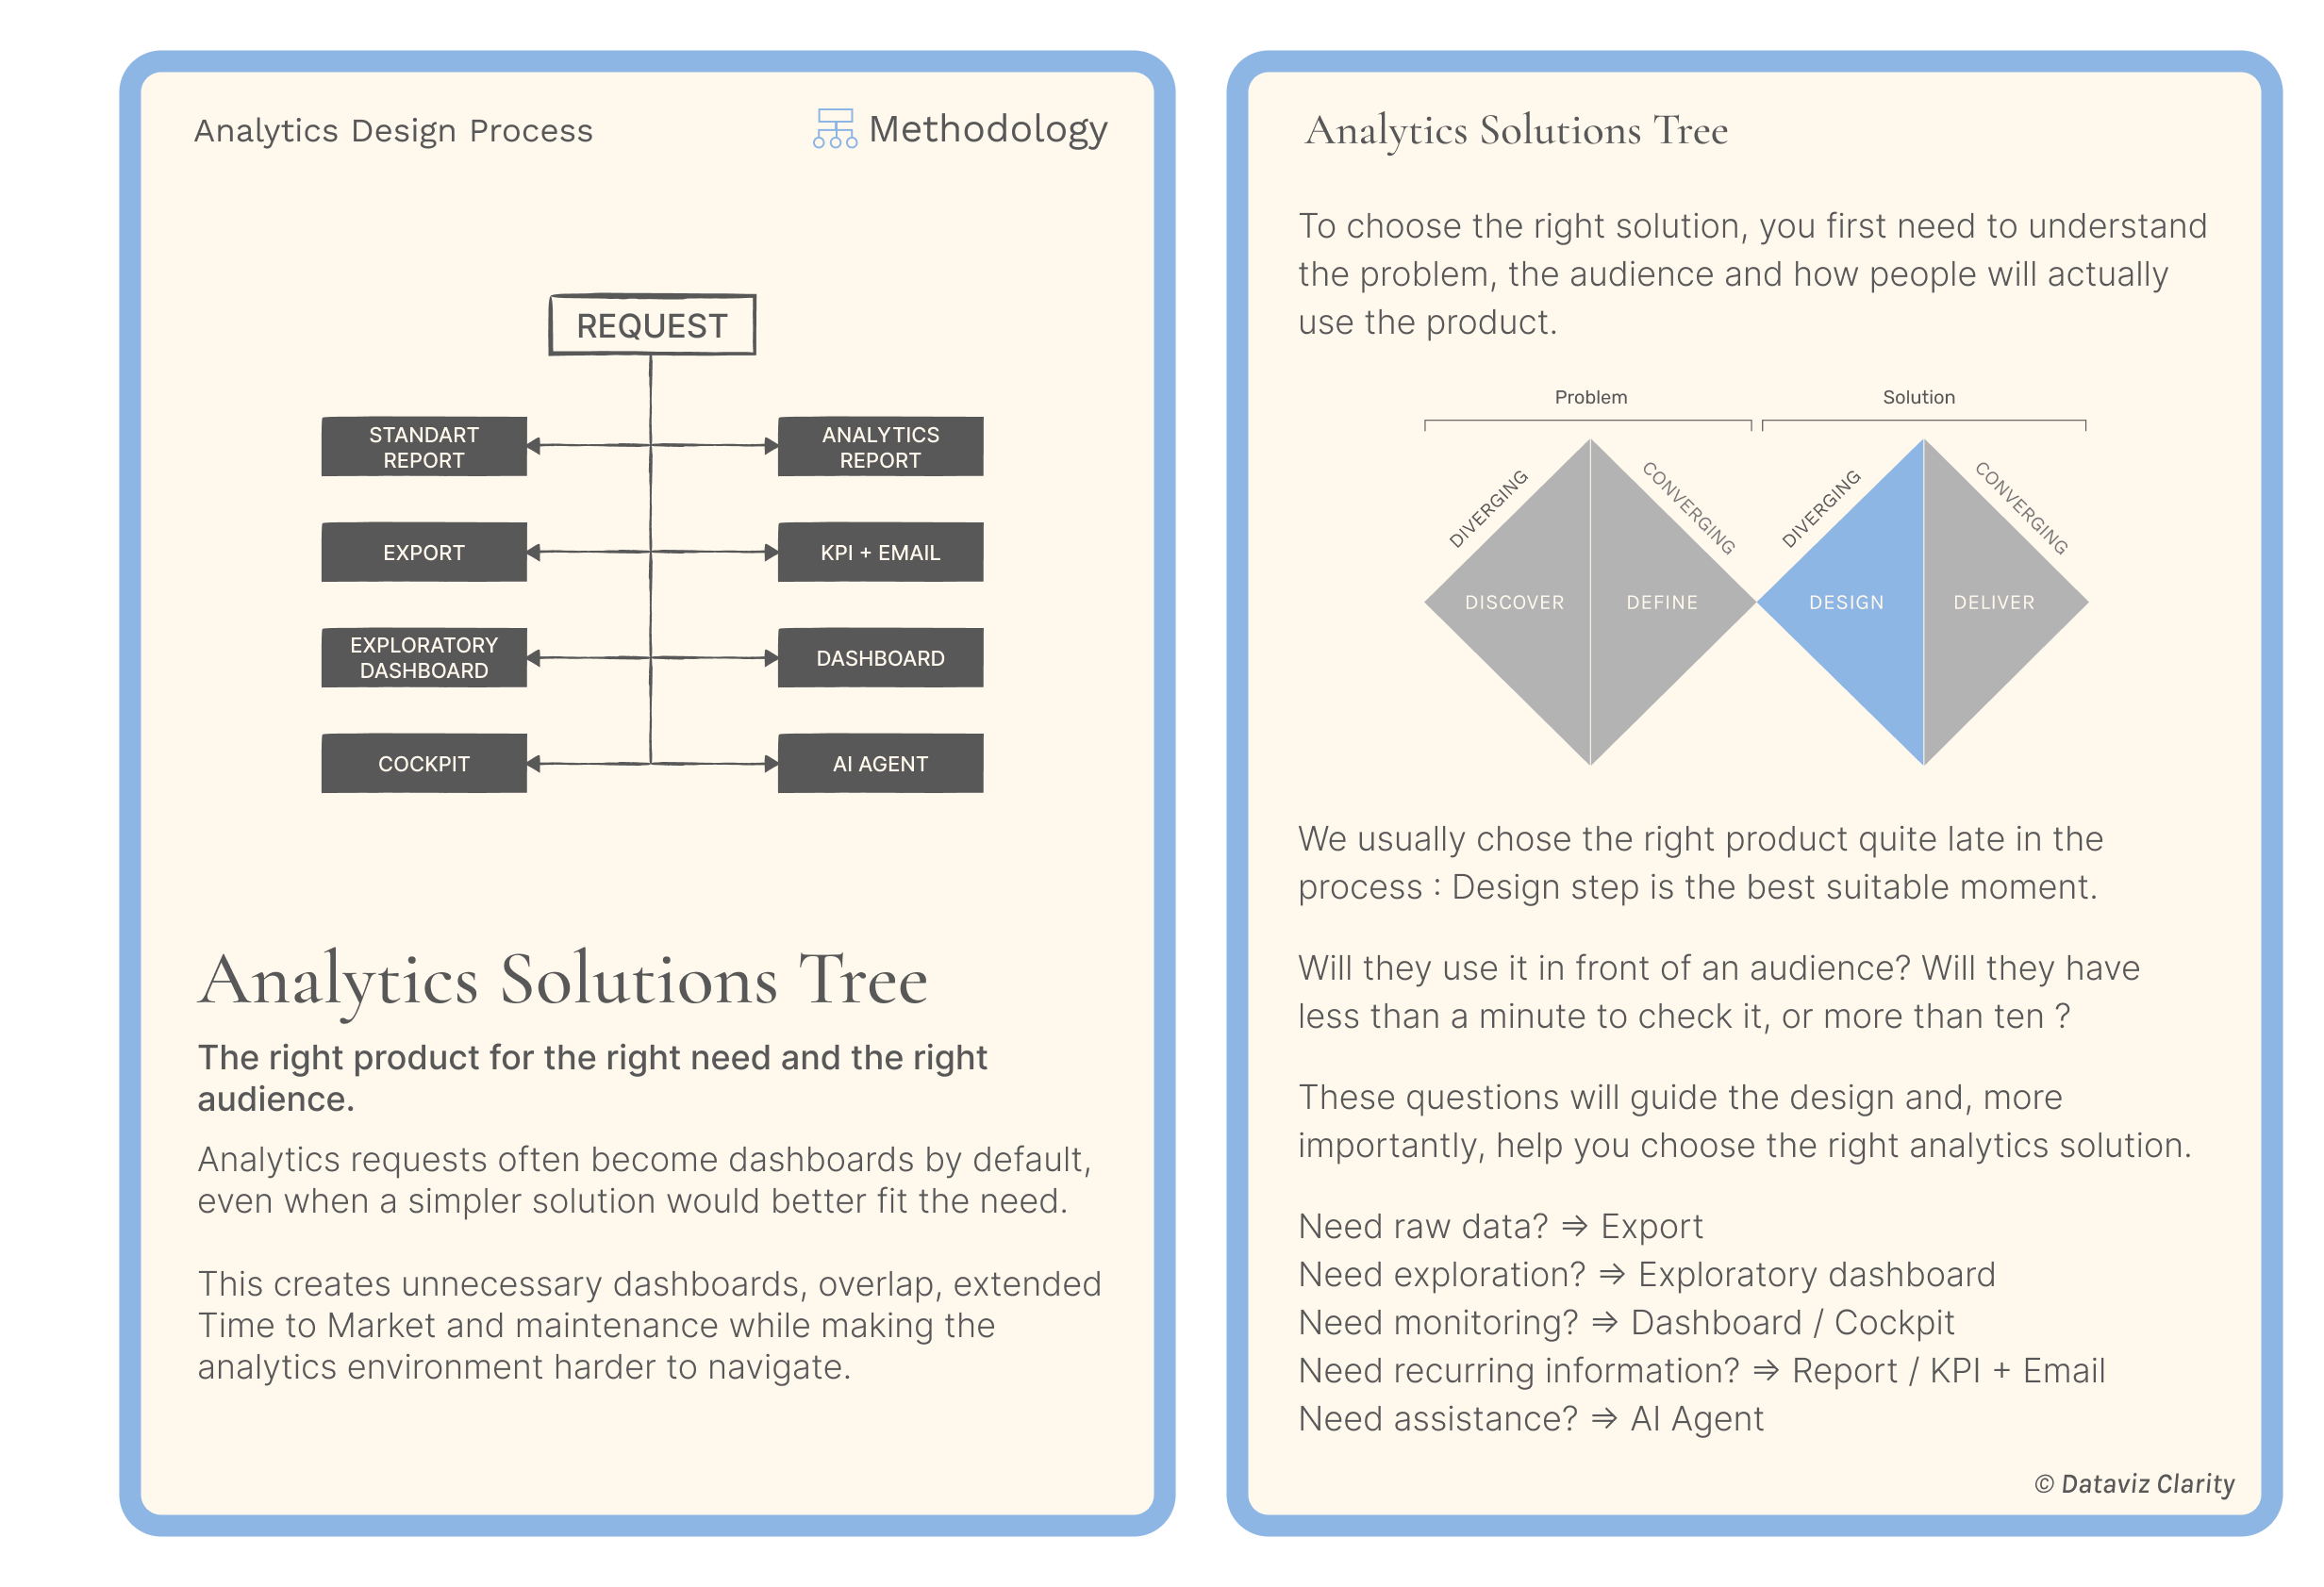
During the Design step, the Analytics Solution Tree helps you explore different solutions before committing to development.
A KPI, a report, an export, an alert, a dashboard, or AI agent?
The right choice depends on the problem you're trying to solve, the audience, and how the information will be used.
The card provides a practical methodology to guide that decision and avoid turning every business request into another dashboard.
Aurélien
Whenever you're ready, there are 2 ways I can help you or your team:
- Analytics Design Principles Workshop: One-day workshops to learn design principles, improve your design process, build your design system, or help business teams make better decisions with data.
- E-Learning: 6+ hours of on-demand content, interactive lessons, and practical exercises to master the fundamental design principles behind clear, intuitive, and impactful dashboards.

Responses