
Dashboard Accumulation: Continuing the card series
*]:pointer-events-auto scroll-mt-(--header-height)" dir="auto" tabindex="-1">
*]:pointer-events-auto scroll-mt-[calc(var(--header-height)+min(200px,max(70px,20svh)))]" dir="auto" tabindex="-1">
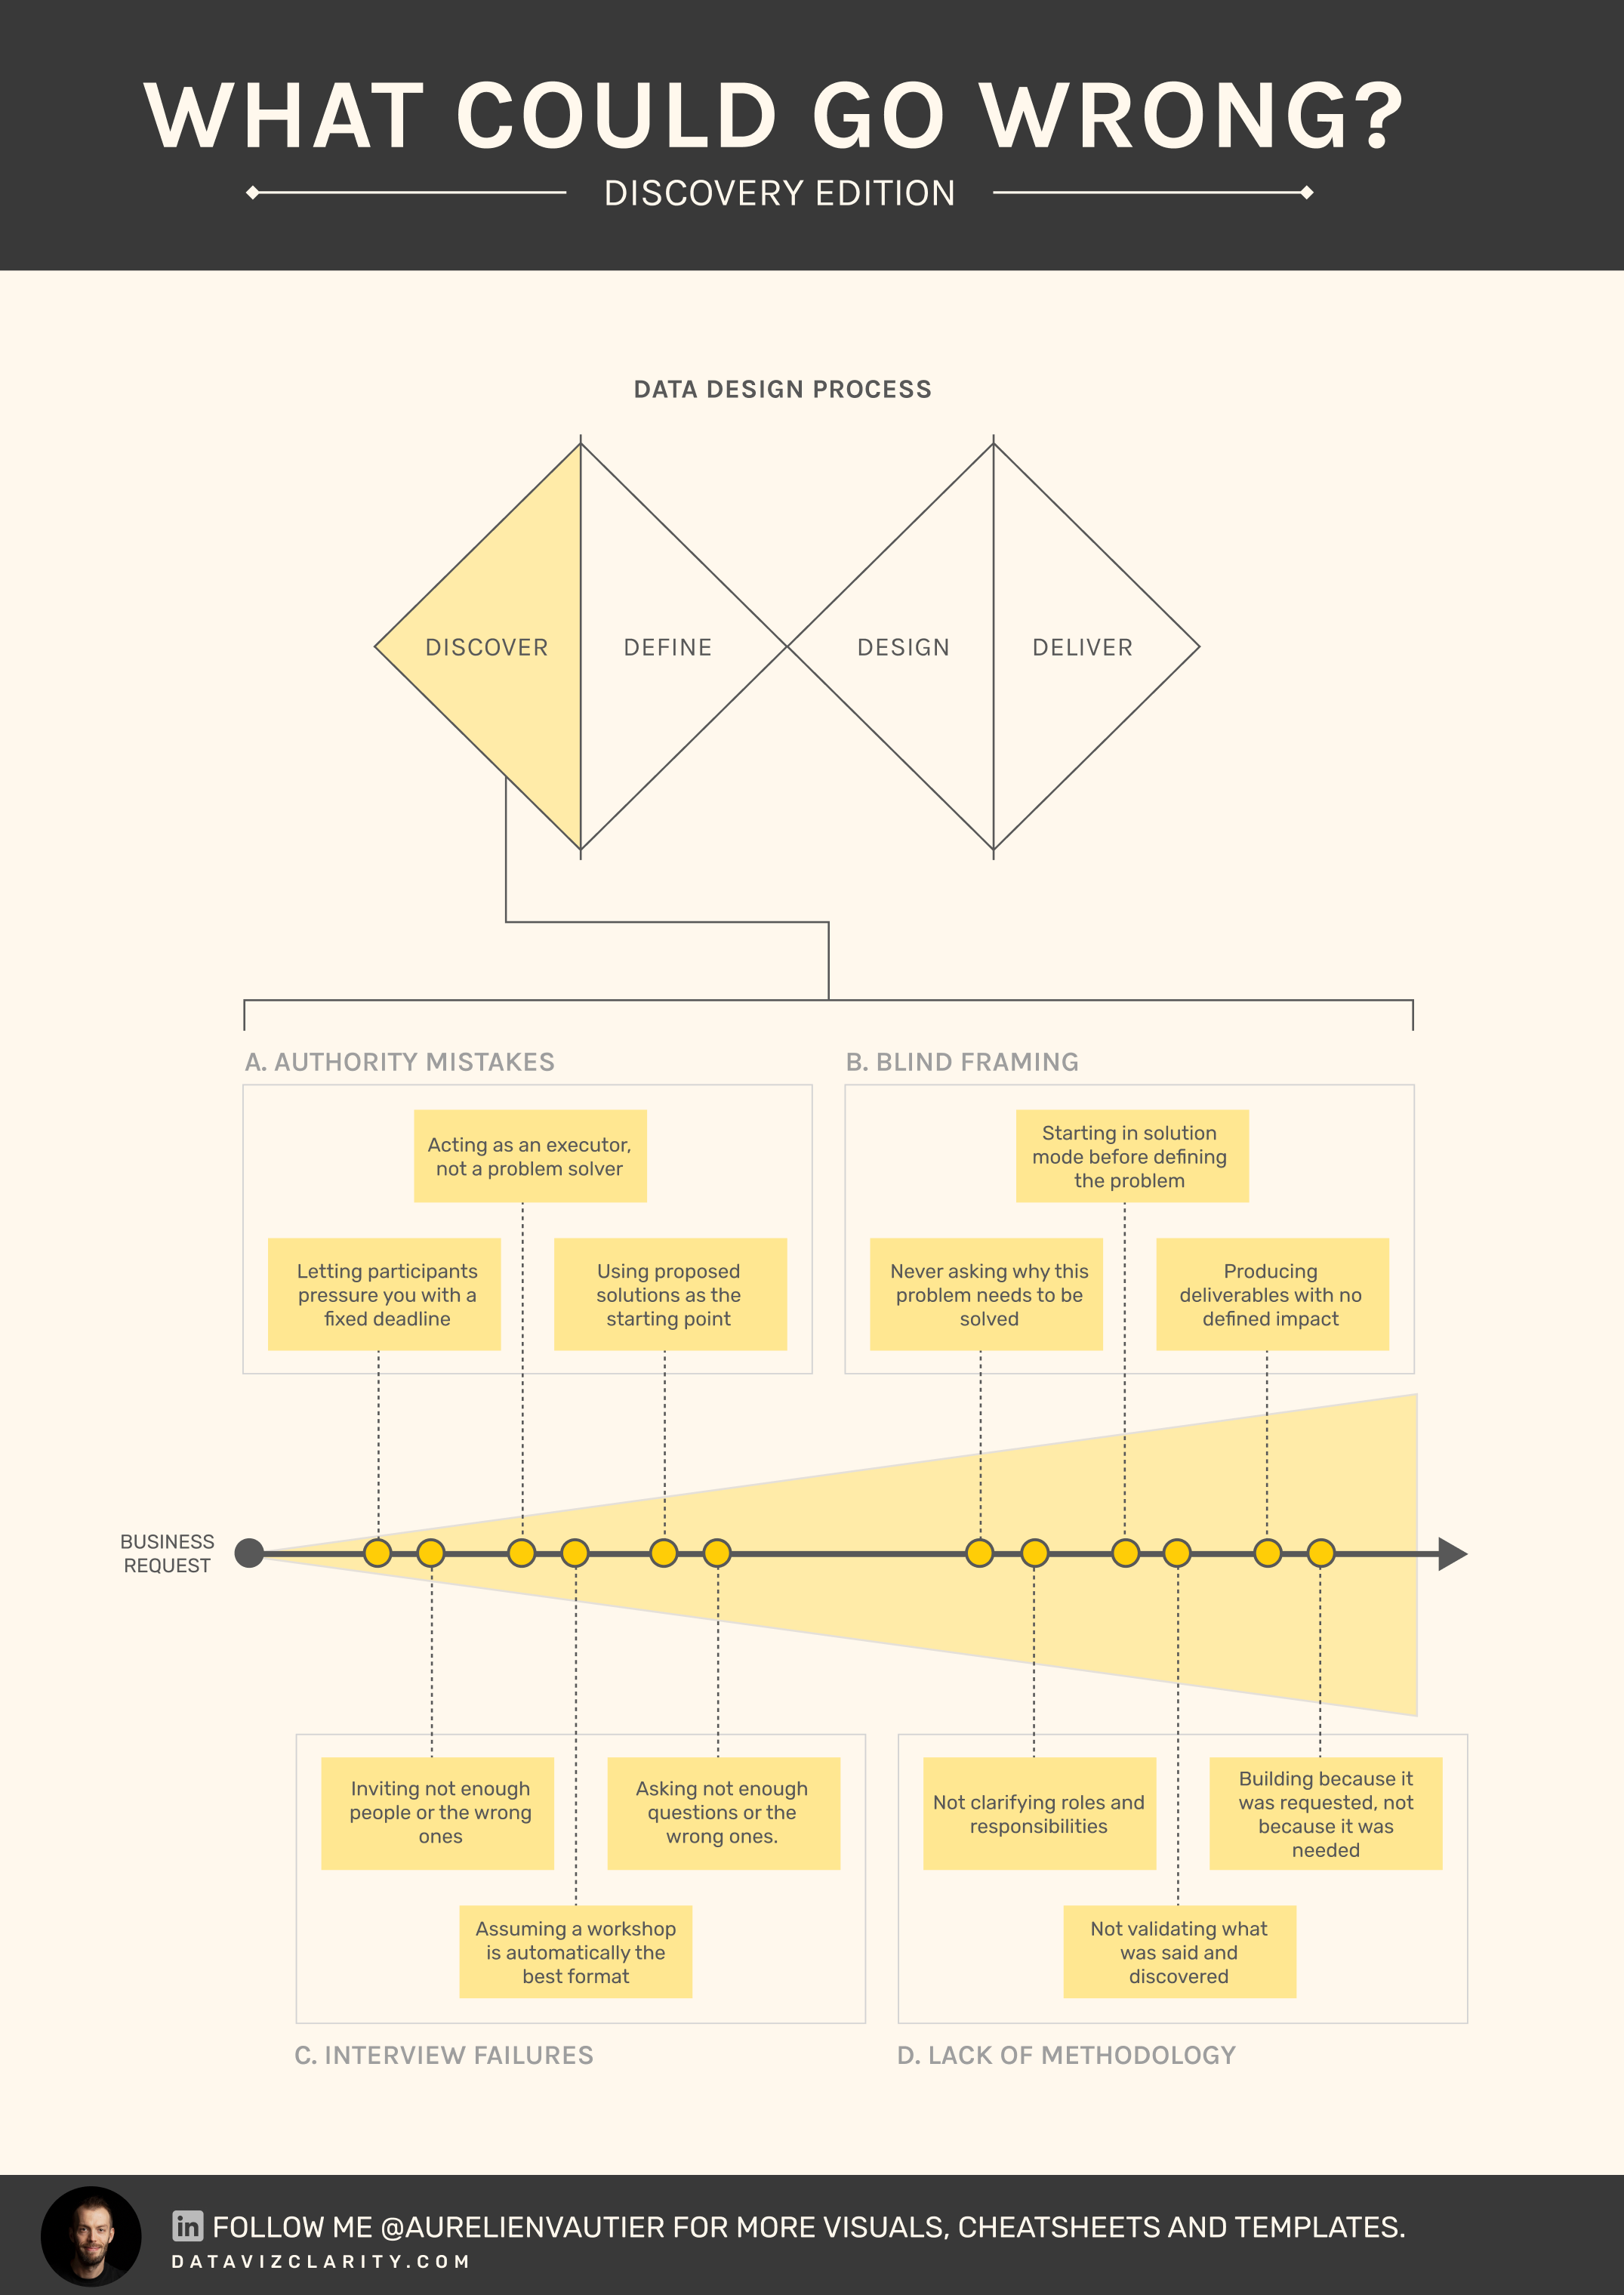
I'm really enjoying creating these cards and using them in workshops, mentoring sessions, and conversations with teams and leaders.
As always, I'd love to hear your feedback.
And if there are situa...
Card N°2: Extreme Users
*]:pointer-events-auto scroll-mt-(--header-height)" dir="auto" tabindex="-1">
*]:pointer-events-auto scroll-mt-[calc(var(--header-height)+min(200px,max(70px,20svh)))]" dir="auto" tabindex="-1">
The second card of the Analytics Product Framework collection is now available: Extreme Users (Methodology card)
One of the most common mistakes I see in organizations is avoiding extreme users dur...
The first card has arrived.
*]:pointer-events-auto scroll-mt-(--header-height)" dir="auto" tabindex="-1">
*]:pointer-events-auto scroll-mt-[calc(var(--header-height)+min(200px,max(70px,20svh)))]" dir="auto" tabindex="-1">
Last week, I challenged myself to start creating a library of cards.
Each card captures a recurring trap, friction, or pattern I have seen repeatedly in analytics and BI teams.
The goal is simple:
...

Responses